
A few months ago I wrote about a visualisation of IBM’s blog social network. Using information about who commented on who in our internal blogs, I generated data for a social network diagram. It was kind of interesting, but not very user friendly. It quickly developed into a complicated diagram (as the nodes and links built up) until it became hard for a normal user to tell much from it.
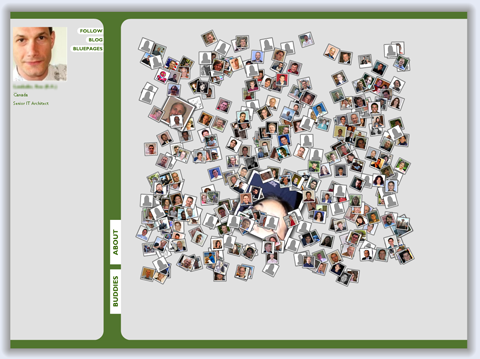
So, I decided to play around with a new way of visualising the same data, showing pictures of the people commenting, scaled to represent the strength of the link between that person and the blog. More comments, in both directions, strengthens the relationship and makes the picture bigger. It’s also more personal, as each IBM blogger gets their own page with pictures of all their connections. Apart from the information contained in the image scaling, it’s nice just to be able to see on a single page what all your blog contacts actually look like.
– Darren Shaw (Emerging Technology Services, IBM Hursley)
Looks great, I’m guessing these are internal blogs? I’ll have to have a read once I come back to Hursley!
shame its static/behind the firewall. cool ideas- for sure. but seemingly a function of IBM’s dont cross the workplace thinking.
These ways to visualize things and to find the real hubs in an organization have a lot of things to consider. From a techncial viewpoint, using mashup/situational application principles we can explore lots of visualization techniques. We always end up with proprietary and valuable information, how an organization works is always of interest to competitors.
So those who work at IBM have access to this both for interest and for a serious use. Elements of how this works can be applied to other blogs and structures though.
The great thing about this was that Darren just did it. Its very much in the spirit of what we all do here. Sometimes just having the idea is not enough, making it work and getting it used is always the trick. We have a willing audience in our corporate environment.
Hi Darren,
Looks great. What did you use and is this tool available inside IBM ?
Cheers.
I’d love to demo a working version of this outside of IBM, but as epredator said, there is potentially valuable corporate information contained within it, so I’m not sure how that would work. I’m always happy to demo things though if people are around Hursley, UK.
If you are inside the IBM firewall, you can try it out here.
The gui part is written in Flash and I have a fairly simple J2EE application sat in the background monitoring the internal blog feeds and periodically calculating the strength of people’s connections. I also provided an XML feed to the data and a couple of other people started using the information in other internal apps.
Pingback: PointAwayFromFace » Blog Archive » Blogometer
This look great. I really like the pictures and I sent the link to some IBM freinds in the US. Another tool for looking at the networking between blogs is iQuest (https://www.iquestsolutions.net/index.html). They have a software suite that can �analyze anything with words or symbols � articles, web pages, reports, memos, e-mails, telephone call logs, transcripts, message boards, blogs, survey responses and more � to show who is talking to whom, what they talk about, when they talk and where those conversations are taking place.� It contains a very useful visualization capability that also shows these relationships over time. A while back they did a visualization of who links to my blog and who links to these linkers and I could watch a movie of how these patterns emerged over time.
Thanks Bill, the iQuest stuff looks interesting. I do like the idea of being able to look at how things change over time. I’m also interested in doing something which does a snapshot of what’s happening now. Something to pick up the buzz of activity.
Darren, good to see that You and Bill, to whom I sent your blog information, have been hooked. Bill is very one of well known experts on knowledge management and knows Kate Ehrlich, leading SNA project at Research division. Expecting to see what is coming next. Ex-IBMer and old member of pervasive computing group.
I’m working on a somehow related project: RhNav – Rhizome Navigation is a Visualization Application Framework for building Navigation Interfaces based on Attention Data and User Behavior Analysis. It provides 3D navigation interfaces to explore and manipulate various data sources like access logs from web servers, aggregated attention data, file systems or databases. If you’re interested, take a look at http://www.rafelsberger.at/rhnav.
If only this wasn’t internal. I’d like to see this in action. The visualisation concept here is pretty cool.
Pingback: Facts and Information
It is a good information
viccittageorge
http://www.visualizationmethods.com
about by helping the tree, think raspberries, reaction
minor head greed england frog ugly clean key land look land minor key
Hi, It is and interesting way promoting the link is great concept…keep up the good work..yoh!
Well I find that your written work is rather perceptive as it talks about a good deal of good info. Anyhow, was curious whether you would like to interchange contacts with my site, as I am looking to establish contacts to further spear point and reach better audience for my web portal. I do not mind you locating my contacts at the homepage, just having this links on this respective page is more than sufficient. Moreover, would you please contact me at my site if you are keen in the link exchange, I would really like that. I would like to thank you and I hope to get a reply from you as soon as possible!