Monkigras 2014: Sharing craft

After Monkigras 2013, I was really looking forward to Monkigras 2014. The great talks about developer culture and creating usable software, the amazing buzz and friendliness of the event, the wonderful lack of choice over which talks to go to (there’s just one track!!), and (of course) the catering:

coffeecheese

The talks at Monkigras 2014

The talks were pretty much all great so I’m just going to mention the talks that were particularly relevant to me.

Rafe Colburn from Etsy talked about how to motivate developers to fix bugs (IBMers, read ‘defects’) when there’s a big backlog of bugs to fix. They’d tried many strategies, including bug rotation, but none worked. The answer, they found, was to ask their support team to help prioritise the bugs based on the problems that users actually cared about. That way, the developers fixing the bugs weren’t overwhelmed by the sheer numbers to choose from. Also, when they’d done a fix, the developers could feel that they’d made a difference to the user experience of the software.

rafe
Rafe Colburn from Etsy

While I’m not responsible for motivating developers to fix bugs, my job does involve persuading developers to write articles or sample code for WASdev.net. So I figure I could learn a few tricks.

A couple of talks that were directly applicable to me were Steve Pousty‘s talk on how to be a developer evangelist and Dawn Foster‘s on taking lessons on community from science fiction. The latter was a quick look through various science fiction themes and novels applied to developer communities, which was a neat idea though I wished I’d read more of the novels she cited. I was particularly interested in Steve’s talk because I’d seen him speak last year about how his PhD in Ecology had helped him understand communities as ecosystems in which there are sometimes surprising dependencies. This year, he ran through a checklist of attributes to look for when hiring a developer evangelist. Although I’m not strictly a developer evangelist, there’s enough overlap with my role to make me pay attention and check myself against each one.

dawn
Dawn Foster from Puppet Labs

One of the risks of TED Talk-style talks is that if you don’t quite match up to the ‘right answers’ espoused by the speakers, you could come away from the event feeling inadequate. The friendly atmosphere of Monkigras, and the fact that some speakers directly contradicted each other, meant that this was unlikely to happen.

It was still refreshing, however, to listen to Theo Schlossnagle basically telling people to do what they find works in their context. Companies are different and different things work for different companies. Similarly, developers are people and people learn in different ways so developers learn in different ways. He focused on how to tell stories about your own failures to help people learn and to save them from having to make the same mistakes.

Again, this was refreshing to hear because speakers often tell you how you should do something and how it worked for them. They skim over the things that went wrong and end up convincing you that if only you immediately start doing things their way, you’ll have instant success. Or that inadequacy just kicks in like when you read certain people’s Facebook statuses. Theo’s point was that it’s far more useful from a learning perspective to hear about the things that went wrong for them. Not in a morbid, defeatist way (that way lies only self-pity and fear) but as a story in which things go wrong but are righted by the end. I liked that.

theo
Theo Schlossnagle from Circonus

Ana Nelson (geek conference buddy and friend) also talked about storytelling. Her point was more about telling the right story well so that people believe it rather than believing lies, which are often much more intuitive and fun to believe. She impressively wove together an argument built on various fields of research including Psychology, Philosophy, and Statistics. In a nutshell, the kind of simplistic headlines newspapers often publish are much more intuitive and attractive because they fit in with our existing beliefs more easily than the usually more complicated story behind the headlines.

ana
Ana Nelson from Brick Alloy

The Gentle Author spoke just before lunch about his daily blog in which he documents stories from local people. I was lucky enough to win one of his signed books, which is beautiful and engrossing. Here it is with my swagbag:

After his popular talk last year, Phil Gilbert of IBM returned to give an update on how things are going with Design@IBM. Theo’s point about context of a company being important is so relevant when trying to change the culture of such a large company. He introduced a new card game that you can use to help teach people what it’s like to be a designer working within the constraints of a real software project. I heard a fair amount of interest from non-IBMers who were keen for a copy of the cards to be made available outside IBM.

wildducksgame
Phil Gilbert’s Wild Ducks card game

On the UX theme, I loved Leisa Reichelt‘s talk about introducing user research to the development teams at GDS. While all areas of UX can struggle to get taken seriously, user research (eg interviewing participants and usability testing) is often overlooked because it doesn’t produce visual designs or code. Leisa’s talk was wonderfully practical in how she related her experiences at GDS of proving the worth of user research to the extent that the number of user researchers has greatly increased.

And lastly I must mention Project Andiamo, which was born at Monkigras 2013 after watching a talk about laser scanning and 3D printing old railway trains. The project aims to produce medical orthotics, like splints and braces, by laser scanning the patient’s body and then 3D printing the part. This not only makes the whole process much quicker and more comfortable, it is at a fraction of the cost of the way that orthotics are currently made.

projectandiamo
Samiya Parvez & Naveed Parvez of Project Andiamo

If you can help in any way, take a look at their website and get in touch with them. Samiya and Naveed’s talk was an amazing example of how a well-constructed story can get a powerful message across to its listeners:

After Monkigras 2014, I’m now really looking forward to Monkigras 2015.


The post Monkigras 2014: Sharing craft appeared first on LauraCowen.co.uk.

Monkigras 2014: Sharing craft

After Monkigras 2013, I was really looking forward to Monkigras 2014. The great talks about developer culture and creating usable software, the amazing buzz and friendliness of the event, the wonderful lack of choice over which talks to go to (there’s just one track!!), and (of course) the catering:

coffeecheese

The talks at Monkigras 2014

The talks were pretty much all great so I’m just going to mention the talks that were particularly relevant to me.

Rafe Colburn from Etsy talked about how to motivate developers to fix bugs (IBMers, read ‘defects’) when there’s a big backlog of bugs to fix. They’d tried many strategies, including bug rotation, but none worked. The answer, they found, was to ask their support team to help prioritise the bugs based on the problems that users actually cared about. That way, the developers fixing the bugs weren’t overwhelmed by the sheer numbers to choose from. Also, when they’d done a fix, the developers could feel that they’d made a difference to the user experience of the software.

rafe
Rafe Colburn from Etsy

While I’m not responsible for motivating developers to fix bugs, my job does involve persuading developers to write articles or sample code for WASdev.net. So I figure I could learn a few tricks.

A couple of talks that were directly applicable to me were Steve Pousty‘s talk on how to be a developer evangelist and Dawn Foster‘s on taking lessons on community from science fiction. The latter was a quick look through various science fiction themes and novels applied to developer communities, which was a neat idea though I wished I’d read more of the novels she cited. I was particularly interested in Steve’s talk because I’d seen him speak last year about how his PhD in Ecology had helped him understand communities as ecosystems in which there are sometimes surprising dependencies. This year, he ran through a checklist of attributes to look for when hiring a developer evangelist. Although I’m not strictly a developer evangelist, there’s enough overlap with my role to make me pay attention and check myself against each one.

dawn
Dawn Foster from Puppet Labs

One of the risks of TED Talk-style talks is that if you don’t quite match up to the ‘right answers’ espoused by the speakers, you could come away from the event feeling inadequate. The friendly atmosphere of Monkigras, and the fact that some speakers directly contradicted each other, meant that this was unlikely to happen.

It was still refreshing, however, to listen to Theo Schlossnagle basically telling people to do what they find works in their context. Companies are different and different things work for different companies. Similarly, developers are people and people learn in different ways so developers learn in different ways. He focused on how to tell stories about your own failures to help people learn and to save them from having to make the same mistakes.

Again, this was refreshing to hear because speakers often tell you how you should do something and how it worked for them. They skim over the things that went wrong and end up convincing you that if only you immediately start doing things their way, you’ll have instant success. Or that inadequacy just kicks in like when you read certain people’s Facebook statuses. Theo’s point was that it’s far more useful from a learning perspective to hear about the things that went wrong for them. Not in a morbid, defeatist way (that way lies only self-pity and fear) but as a story in which things go wrong but are righted by the end. I liked that.

theo
Theo Schlossnagle from Circonus

Ana Nelson (geek conference buddy and friend) also talked about storytelling. Her point was more about telling the right story well so that people believe it rather than believing lies, which are often much more intuitive and fun to believe. She impressively wove together an argument built on various fields of research including Psychology, Philosophy, and Statistics. In a nutshell, the kind of simplistic headlines newspapers often publish are much more intuitive and attractive because they fit in with our existing beliefs more easily than the usually more complicated story behind the headlines.

ana
Ana Nelson from Brick Alloy

The Gentle Author spoke just before lunch about his daily blog in which he documents stories from local people. I was lucky enough to win one of his signed books, which is beautiful and engrossing. Here it is with my swagbag:

After his popular talk last year, Phil Gilbert of IBM returned to give an update on how things are going with Design@IBM. Theo’s point about context of a company being important is so relevant when trying to change the culture of such a large company. He introduced a new card game that you can use to help teach people what it’s like to be a designer working within the constraints of a real software project. I heard a fair amount of interest from non-IBMers who were keen for a copy of the cards to be made available outside IBM.

wildducksgame
Phil Gilbert’s Wild Ducks card game

On the UX theme, I loved Leisa Reichelt‘s talk about introducing user research to the development teams at GDS. While all areas of UX can struggle to get taken seriously, user research (eg interviewing participants and usability testing) is often overlooked because it doesn’t produce visual designs or code. Leisa’s talk was wonderfully practical in how she related her experiences at GDS of proving the worth of user research to the extent that the number of user researchers has greatly increased.

And lastly I must mention Project Andiamo, which was born at Monkigras 2013 after watching a talk about laser scanning and 3D printing old railway trains. The project aims to produce medical orthotics, like splints and braces, by laser scanning the patient’s body and then 3D printing the part. This not only makes the whole process much quicker and more comfortable, it is at a fraction of the cost of the way that orthotics are currently made.

projectandiamo
Samiya Parvez & Naveed Parvez of Project Andiamo

If you can help in any way, take a look at their website and get in touch with them. Samiya and Naveed’s talk was an amazing example of how a well-constructed story can get a powerful message across to its listeners:

After Monkigras 2014, I’m now really looking forward to Monkigras 2015.


Node-RED Flows that make flows

Executive Summary

When a mummy function node and a daddy function node love each other very much, the daddy node injects a payload into the mummy node through a wire between them, and a new baby message flow is made, which comes out of mummy’s output terminal. The baby’s name is Jason.

Where did this idea come from?

In Node-RED, if you export some nodes to the clipboard, you will see the flow and its connections use a JSON wire format.

For a few weeks I’ve been thinking about generating that JSON programmatically, in order to create flows which encode various input and output capabilities and functions, according to some input parameters which give the specific details of what the flow is to do.

I think there’s been an alignment of planets that’s occurred, which led to this idea:

@stef_k_uk has been talking to me about deploying applications onto “slave” Raspberry Pis from a master Pi.

Dritan Kaleshi and Terence Song from Bristol University have been discussing using the Node-RED GUI as a configurator tool for a system we’re working on together, and also we’ve been working on representing HyperCat catalogues in Node-RED, as part of our Technology Strategy Board Internet of Things project, IoT-Bay.

@rocketengines and I were cooking up cool ideas for cross-compiling Node-RED flows into other languages, a while back, and

in a very productive ideas afternoon last week, @profechem and I stumbled upon an idea for carrying the parser for a data stream along with the data itself, as part of its meta-data description.

All of the above led me to think “wouldn’t it be cool if you could write a flow in Node-RED which produced as output another flow.” And for this week’s #ThinkFriday afternoon, I gave it a try.

First experiment

The first experiment was a flow which had an injector node feeding a JSON object of parameters into a flow which generated the JSON for an MQTT input node, a function node to process the incoming data in some way, and an MQTT output node. So it was the classic subscribe – process – publish pattern which occurs so often in our everday lives (if you live the kind of life that I do!).
first Node-RED flow
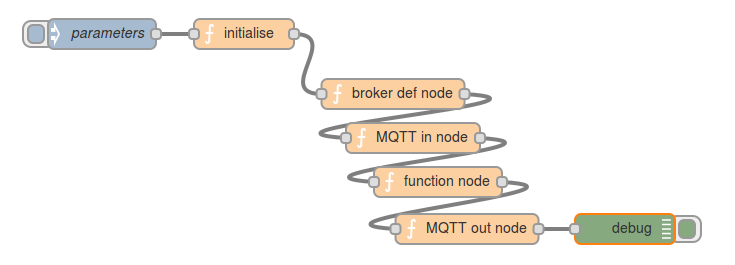
And here’s the Node-RED flow which generates that:
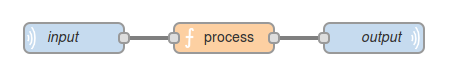
 flow-generator

So if you sent in
{
"broker": "localhost",
"input": "source_topic",
"output": "destination_topic",
"process": "msg.payload = \"* \"+msg.payload+\" *\";\nreturn msg;"
}

the resulting JSON would be the wire format for a three-node flow which has an MQTT input node subscribed to “source_topic” on the broker on “localhost”, a function node which applies a transformation to the data: in this case, wrapping it with an asterisk at each end, and finally an MQTT publish node sending it to “destination_topic” on “localhost”.
N.B. make sure you escape any double quotes in the “process” string, as shown above.

The JSON appears in the debug window. If you highlight it, right-mouse – Copy, and then do Import from… Clipboard in Node-RED and ctrl-V the JSON into the text box and click OK, you get the three node flow described above ready to park on your Node-RED worksheet and then Deploy.
the resulting And it works!!

So what?

So far so cool. But what can we do with it?

The next insight was that the configuration message (supplied by the injector) could come from somewhere else. An MQTT topic, for example. So now we have the ability for a data stream to be accompanied not only by meta-data describing what it is, but also have the code which parses it.
flow with added MQTT configurator
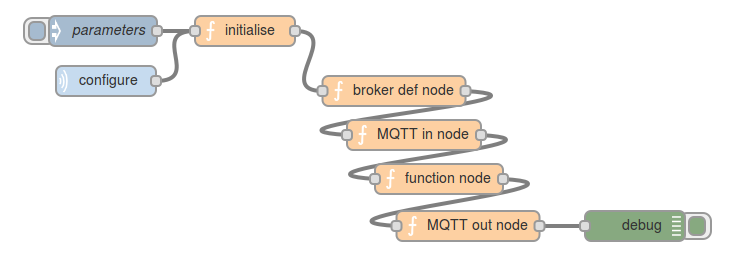
My thinking is that if you subscribe to a data topic, say:
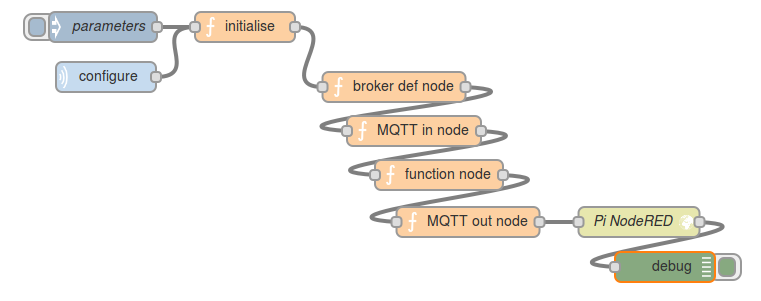
andy/house/kitchen/temperature
there could be two additional topics, published “retained” so you get them when you first subscribe, and then any updates thereafter:

A metadata topic which describes, in human and/or machine readable form, what the data is about, for example:
andy/house/kitchen/temperature/meta with content
“temperature in degrees Celcius in the kitchen at Andy’s house”

And a parser topic which contains the code which enables the data to be parsed:
andy/house/kitchen/temperature/parser with content
msg.value = Math.round(msg.payload) + \" C\"; return msg;
(that’s probably a rubbish example of a useful parser, but it’s just for illustration!)

If you’re storing your data in a HyperCat metadata catalogue (and you should think about doing so if you’re not – see @pilgrimbeart‘s excellent HyperCat in 15 minutes presentation), then the catalogue entry for the data point could include the URI of the parser function along with the other meta-data.

And then…

Now things get really interesting… what if we could deploy that flow we’ve created to a node.js run-time and set it running, as if we’d created the flow by hand in the Node-RED GUI and clicked “Deploy”?
Well we can!

When you click Deploy, the Node-RED GUI does an HTTP POST to “/flows” in the node.js run-time that’s running the Node-RED server (red.js), and sends it the list of JSON objects which describe the flow that you’ve made.
So… if we hang an HTTP request node off the end of the flow which generates the JSON for our little flow, then it should look like a Deploy from a GUI.

Et voila!
flow that deploys to a remote Node-RED
Note that you have to be careful not to nuke your flow-generating-flow by posting to your own Node-RED run-time! I am posting the JSON to Node-RED on my nearby Raspberry Pi. When you publish a configuration message to the configuration topic of this flow, the appropriate set of nodes is created – input – process – output – and then deployed to Node-RED on the Pi, which dutifully starts running the flow, subscribing to the specified topic, transforming the data according to the prescribed processing function, and publishing it to the specified output topic.

I have to say, I think this is all rather exciting!

@andysc

Footnote:

It’s worth mentioning, that Node-RED generates unique IDs for nodes that look like “8cf45583.109bf8”. I’m not sure how it does that, so I went for a simple monotonically increasing number instead (1, 2 …). It seems to work fine, but there might be good reasons (which I’m sure @knolleary will tell me about) why I should do it the “proper” way.

At ThingMonk 2013

I attended ThingMonk 2013 conference partly because IBM’s doing a load of work around the Internet of Things (IoT). I figured it would be useful to find out what’s happening in the world of IoT at the moment. Also, I knew that, as a *Monk production, the food would be amazing.

What is the Internet of Things?

If you’re reading this, you’re familiar with using devices to access information, communicate, buy things, and so on over the Internet. The Internet of Things, at a superficial level, is just taking the humans out of the process. So, for example, if your washing machine were connected to the Internet, it could automatically book a service engineer if it detects a fault.

I say ‘at a superficial level’ because there are obviously still issues relevant to humans in an automated process. It matters that the automatically-scheduled appointment is convenient for the householder. And it matters that the householder trusts that the machine really is faulty when it says it is and that it’s not the manufacturer just calling out a service engineer to make money.

This is how James Governor of RedMonk, who conceived and hosted ThingMonk 2013, explains IoT:

What is ThingMonk 2013?

ThingMonk 2013 was a fun two-day conference in London. On Monday was a hackday with spontaneous lightning talks and on Tuesday were the scheduled talks and the evening party. I wasn’t able to attend Monday’s hackday so you’ll have to read someone else’s write-up about that (you could try Josie Messa’s, for instance).

The talks

I bought my Arduino getting started kit (which I used for my Christmas lights energy project in 2010) from Tinker London so I was pleased to finally meet Tinker’s former-CEO, Alexandra Dechamps-Sonsino, at ThingMonk 2013. I’ve known her on Twitter for about 4 years but we’d never met in person. Alex is also founder of the Good Night Lamp, which I blogged about earlier this year. She talked at ThingMonk about “the past, present and future of the Internet of Things” from her position of being part of it.

Alexandra Deschamps-Sonsino, @iotwatch

I think it was probably Nick O’Leary who first introduced me to the Arduino, many moons ago over cups of tea at work. He spoke at ThingMonk about wiring the Internet of Things. This included a demo of his latest project, NodeRED, which he and IBM have recently open sourced on GitHub.

Nick O'Leary talks about wiring the Internet of Things
Nick O’Leary talks about wiring the Internet of Things

Sadly I missed the previous day when it seems Nick and colleagues, Dave C-J and Andy S-C, won over many of the hackday attendees to the view that IBM’s MQTT and NodeRED are the coolest things known to developerkind right now. So many people mentioned one or both of them throughout the day. One developer told me he didn’t know why he’d not tried MQTT 4 years ago. He also seemed interested in playing with NodeRED, just as soon as the shock that IBM produces cool things for developers had worn off.

Ian Skerrett from Eclipse talked about the role of Open Source in the Internet of Things. Eclipse has recently started the Paho project, which focuses on open source implementations of the standards and protocols used in IoT. The project includes IBM’s Really Small Message Broker and Roger Light’s Mosquitto.

Ian Skerrett from Eclipse

Andy Piper talked about the role of signals in the IoT.

IMG_1546

There were a couple of talks about people’s experiences of startups producing physical objects compared with producing software. Tom Taylor talked about setting up Newspaper Club, which is a site where you can put together and get printed your own newspaper run. His presentation included this slide:

IMG_1534Matt Webb talked about producing Little Printer, which is an internet-connected device that subscribes to various sources and prints them for you on a strip of paper like a shop receipt.

IMG_1550Patrick Bergel made the very good point in his talk that a lot of IoT projects, at the moment, are aimed at ‘non-problems’. While fun and useful for learning what we can do with IoT technologies, they don’t really address the needs of real people (ie people who aren’t “hackers, hipsters, or weirdos”). For instance, there are increasing numbers of older people who could benefit from things that address problems social isolation, dementia, blindness, and physical and cognitive impairments. His point was underscored throughout the day by examples of fun-but-not-entirely-useful-as-is projects, such as flying a drone with fruit. That’s not to say such projects are a waste of time in themselves but that we should get moving on projects that address real problems too.

IMG_1539The talk which chimed the most with me, though, was Claire Rowland‘s on the important user experience UX issues around IoT. She spoke about the importance of understanding how users (householders) make sense of automated things in their homes.

IMG_1587

The book

I bought a copy of Adrian McEwan‘s Designing The Internet of Things book from Alex’s pop-up shop, (Works)shop. Adrian’s a regular at OggCamp and kindly agreed to sign my copy of his book for me.

Adrian McEwan and the glamorous life of literary reknown.

The food

The food was, as expected, amazing. I’ve never had bacon and scrambled egg butties that melt in the mouth before. The steak and Guinness casserole for lunch was beyond words. The evening party was sustained with sushi and tasty curry.

Thanks, James!

The post At ThingMonk 2013 appeared first on LauraCowen.co.uk.

Why am I still at IBM?

Ten years ago.

6 August 2003.

I was a recent University graduate, arriving at IBM’s R&D site in Hursley for the first time. I remember arriving in Reception.


Reception – the view that greeted me when I arrived

Ten years.

It was a Wednesday.

I’m still at the same company. I’m still at the same site. I still do the same drive to work, more or less.

For a *decade*.

How did that happen?

It was never The Plan. The Plan (as cynical as it sounds in hindsight) was that I’d stay for two or three years. I figured that would be long enough to get experience, and then I’d leave to work at a small nimble start-up which was where all the “cool” work was.

The Plan never happened. A few years passed, and then another few… I kept saying that I’d leave “later” and before I knew it a ten year milestone has kind of snuck up on me.

I think I’m more surprised than anyone. I’ve never been at any place this long. I was at Uni for five years. The longest I was at any school was four years.

It’s a serious commitment, and one I never realised that I had made. I’ve not even been married for as long as I’ve been with IBM.

So why? Why am I still here?

I live here.

It’s been varied

I’ve spent ten years working for the same company, but I’ve had several jobs in this time.

I’ve been a software developer. I’ve been a test engineer. I’ve been a service engineer, fixing problems with customer systems. I’ve worked as a consultant, advising clients about technology through presentations and running workshops. I’ve done services work building prototypes and first-of-a-kind pilot systems for clients.

I’ve written code to run on tiny in-car embedded systems and apps that ran on mobile phones. I’ve worked as a System z Mainframe developer. I’ve written front-end UI code, and I’ve written heavy-duty server jobs that took hours to run (even when they weren’t supposed to).


IBM Hursley

It’s still challenging

I’ve worked on middleware technology, getting some of the biggest computer systems in the world to communicate with each other, reliably, securely and at scale. I’ve used analytics to get insight from massive amounts of data. I’ve worked on large-scale fingerprint and voiceprint systems. I’ve used natural language processing to build systems that attempt to interpret unstructured text. I’ve used machine learning to create systems that can be trained to perform work.

I’m still learning new stuff and still regularly have to figure out how to do stuff that I have no idea how to at the start.


Some views of the grounds around the office

I get to do more than just a “day job”

I do random stuff outside the day job. I’ve helped organise week long schools events to teach kids about science and technology. I’ve mentored teams of University students on summer-long residential innovation projects. I’ve prepared and delivered training courses to school kids, school teachers and charity leaders. I’ve written an academic paper and presented it at a peer-reviewed research conference. And lots more.

I’m a developer, but that doesn’t mean I’ve spent ten years churning out code 40 hours a week. There’s always something new and different.


Hursley House – where I normally work when I have customers visiting

I work on stuff that matters

Tim O’Reilly has been talking for years about the importance of working on stuff that matters.

“Work on something that matters to you more than money”

If you’ve not heard any of his talks around this, I’d recommend having a look. There are lots of examples of his slides, talks, blog posts and interviews around.

I can’t do his message justice here, but I just want to say that he describes a big part of how I feel very well. I want to work on stuff that I can be proud of. Not just technically proud of, although that’s important too. But the pride of doing something that will make a difference.

Working for a massive company gives me chances to do that. I’ve worked on projects for governments, and police forces, and Universities. I’ve done work that I can be proud of.

For the last couple of years, I’ve been working on Watson. It’s a very cool collection of technologies, and watching the demo of it competing on a US game show has a geeky thrill that doesn’t get old. But that’s not the most exciting bit. Watson could be a turning point. This could change how we do computing. If you look at what we’re trying to do with Watson in medicine, we’re trying to transform how we deliver healthcare. This stuff matters. It’s exciting to be a part of.


These are the views that surround the site

I like the lifestyle

Hursley is a campus-style site. It’s miles from the nearest town, and surrounded by fields and farms. It’s quiet and has loads of green open space.

My commute is a ten minute drive through a village and fields.

I don’t have to wear a suit, and I don’t stand out coming to work in a hoodie and combat trousers. Flexitime has been the norm for most of my ten years, and I am free to plan a work day that suits me. When I need to be out of the office by 3pm to get the kids from school, I can.

My kids are at a school half-way between home and the office, so I can do the school run on the way to work. As the school is only five minutes from work, I often nip out to see them do something in an assembly, or have lunch with them.

This is a nice aspect of the school – that parents are welcome to join their kids for lunch, and have a school dinner with them and their friends in the school canteen. But still… it’s pretty cool, and if I didn’t work just up the road from them, I wouldn’t be able to do it.

Once a month, I bring them to work in the morning before school starts for a cooked breakfast in the Clubhouse with the rest of my team.

All of this and a lot more tiny aspects like it add up to a lifestyle that I like.

More train tickets
Some of my train tickets from the last few years

I get to see the world

I enjoy travelling. I love seeing new places.

But I’d hate a job where I lived out of a suitcase and never saw the kids.

I’ve managed to find a nice balance. I travel, but usually on short trips and not too often.

In 2006, I worked at IBM’s La Gaude site near Nice. In 2007, Singapore, Malaysia, Philippines and Paris. In 2008, I worked in Copenhagen, Paris and Hamburg. In 2009, I worked in Munich many times, and Rotterdam. In 2010, Stockholm. In 2011, Tel Aviv and Haifa in Israel, Austin in Texas, Paris and Berlin. Last year, I worked in Zurich and Littleton, Massachusetts.

This year, I’ve been in Rio de Janeiro and Littleton again, and it looks like I’ll be in Lisbon in December.

Plus working around the UK. It’s less glamorous, but it’s still interesting to go to new places. I’ve worked in loads of places, like Edinburgh, York, Swansea, Malvern, Warwick, Portsmouth, Cheshire, Northampton, Guildford… I occasionally have to work in London, although I tend to moan about it. And I spent a few months working in Farnborough. I think I moaned about that, too. :-)

Travelling is a great opportunity. I couldn’t afford to have been to all the places that IBM has sent me if I had to pay for it myself.

The officemy deskCarnage
My office today (left), compared with some of the other desks I’ve had around Hursley

The pay is amazing!

Hahahahaha… no.

See above.


Grace at my desk at a family fun day at work in 2008

Will I be here for another ten years?

I’m trying to explain why I’m happy and enjoying what I do. I’m not saying I couldn’t get exactly the same or better somewhere else. Because I don’t know. Other than a year I spent as an intern at Motorola I’ve never worked anywhere else. For all I know, the grass might be greener somewhere.

Will I still be here in another ten years? I dunno… I do worry if that’s unambitious. I wonder if I should try somewhere else. I wonder if only ever working for one company is giving me an institutionalised and insular view of the world.

I keep getting emails from LinkedIn about all the people I know who have new jobs. There are a bunch of people I used to work with at IBM who have not only left to work at other companies, but have since left those companies and gone on to something even newer. While I’m still here.

Am I destined to be one of those IBMers who works at Hursley forever? That’s a scary thought.

For now, I’m enjoying what I do, so that’s good enough for me.

Happy 10th anniversary to me.


Machine Learning Course

Enough time has passed since I undertook the Stanford University Natural Language Processing Course for me to forget just how much hard work it was for me to start all over again.  This year I decided to have a go at the coursera Machine Learning Course.

Unlike the 12 week NLP course last year which estimated 10 hours a week and turned out to be more like 15-20 hours a week, this course was much more realistic in estimation at 10 weeks of 8 hours.  I think I more or less hit the mark on that point spending about 1 day every week for the past 10 weeks studying machine learning - so around half the time required for the NLP course.

The course was written and presented by Andrew Ng who seems to be rather prolific and somewhat of an academic star in his fields of machine learning and artificial intelligence.  He is one of the co-founders of the coursera site which along with their main rival, Udacity, have brought about the popular rise of Massive Open Online Learning.

The Machine Learning Course followed the same format as the NLP course from last year which I can only assume is the standard coursera format, at least for technical courses anyway.  Each week there were 1 or two main topic areas to study which were presented in a series of videos featuring Andrew talking through a set of slides on which he's able to hand write notes for demonstration purposes, just as if you're sitting in a real lecture hall at university.  To check your understanding of the content of the videos there are questions which must be answered on each topic against which you're graded.  The second main component each week is a programming exercise which for the Machine Learning Course must be completed in Octave - so yet another programming language to add to your list.  Achieving a mark of 80% or above across all the questions and programming exercises results in a course pass.  I appear to have done that with relative ease for this course.

The 18 topics covered were:

  • Introduction
  • Linear Regression with One Variable
  • Linear Algebra Review
  • Linear Regression with Multiple Variables
  • Octave Tutorial
  • Logistic Regression
  • Regularisation
  • Neural Networks Representation
  • Neural Networks Learning
  • Advice for Applying Machine Learning
  • Machine Learning System Design
  • Support Vector Machines
  • Clustering
  • Dimensionality Reduction
  • Anomaly Detection
  • Recommender Systems
  • Large Scale Machine Learning
  • Application Example Photo OCR
The course served as a good revision of some maths I haven't used in quite some time, lots of Linear Algebra for which you need a pretty good understanding and lots of calculus which you didn't really need to understand if all you care about is implementing the algorithms rather than working out how they're derived or proven.  Being quite maths based, the course used matrices and vectorisation very heavily rather than using the loop structures that most of us would use as a go-to framework for writing complex algorithms.  Again, this was some good revision as I've not programmed in this fashion for quite some time.  You're definitely reminded of just how efficient you can make complex tasks on modern processors if you stand back from your algorithm for a bit and work out how best to utilise the hardware (via the appropriately optimised libraries) you have.

The major thought behind the course seems to be to teach as many different algorithms as possible.  There really is a great range.  Starting of simply with linear algorithms and progressing right up to the current state-of-the-art Neural Networks and the ever fashionable map-reduce stuff.

I didn't find the course terribly difficult, I'm no expert in any of the topics but have studied enough maths not to struggle with that side of things and don't struggle with programming either.  I didn't need to use the forums or any of the other social elements offered during the course so I don't really have a feel for how others found the course.  I can certainly imagine someone finding it a real struggle if they don't have a particularly deep background in either maths or programming.

There was, as far as I can think right now, one (or maybe two depending on how you count) omission from the course.  Most of the programming exercises were heavily frameworked for you in advance, you just have to fill in the gaps.  This is great for learning the various different algorithms presented during the course but does leave a couple of areas at the end of the course you're not so confident with (aside from not really having a wide grasp of the Octave programming language).  The omission of which I speak is that of storing and bootstrapping the models you've trained with the algorithm.  All the exercises concentrated on training a model, storing it in memory, using it and as the program terminates then so your model disappears.  It would have been great to have another module on the best ways to persist models between program runs, and how to continue training (bootstrap) a model that you have already persisted.  I'll feed that thought back to Andrew when the opportunity arises over the next couple of weeks.

The problem going forward wont so much be applying what has been offered here but working out what to apply it to.  The range of problems that can be tackled with these techniques is mind-blowing, just look at the rise of analytics we're seeing in all areas of business and technology.

Overall then, a really nice introduction into the world of machine learning.  Recommended!


W4A : Accessibility of the web

This is the last of four posts sharing some of the things I saw while at the International World Wide Web Conference for w4a.

Several presentations looked at how accessible the web is.

Web Accessibility Snapshot

In 2006, an audit was performed by Nomensa for the United Nations. They reviewed 100 popular websites for conformance to accessibility guidelines.

The results weren’t positive: 97% of sites didn’t meet WCAG level 1.

Obviously, conformance to guidelines doesn’t mean a site is accessible, but it’s an important factor. It’s not sufficient, but it is required. Conformance to guidelines can’t prove that a website is accessible, however there are some guidelines that we can be certain would break accessibility if not followed. So they are at least a useful starting point.

However, 2006 is a long time ago now, and the Internet has changed a lot since. One project, from colleagues of mine at IBM, is creating a more up to date picture of the state of the web. They analysed a thousand of the most popular websites (according to Alexa) as well as a random sampling of a thousand other sites.

(Interestingly, they found no statistically significant difference between conformance in the most popular websites and the randomly selected ones).

Their intention is to perform this regularly, creating a Web Accessibility Snapshot, with regular updates on the status of accessibility of the web. It looks like it could become a valuable source of information.

Assessing accessibility

There was a lot of discussion about how to assess accessibility.

One paper argued there is an over-reliance on automated tools and a lack of awareness of the negative effects of this. They demonstrated a manual review of websites, comparing results with output from six popular tools. Their results showed how few accessibility problems automated tools discover.

Accurately assessing a website against accessibility guidelines doesn’t necessarily mean that you can prove a site is accessible or easy to use.

Some research presented suggests guidelines only cover a little over half of problems encountered by users. Usability studies suggest some websites that don’t meet guidelines may be easier to use than websites that do, as users may have effective coping strategies for (technically) non-compliant sites. This suggests we need a better way of assessing accessibility.

A better approach might be to observe users interact with a website and assess based on their experiences. One tool presented, WebTactics, showed an automated approach to assessing accessibility by observing a user and identifying behaviours they employ.

Another paper detailed how to add accessibility monitoring to a live website by adding additional JavaScript that captures and evaluates mouse clicks and button presses client-side before submitting them to a server for processing. Instead of requiring the user to perform predefined, and perhaps artificial, tasks, they hope to be able to discover tasks implicitly – that common tasks will emerge from the low-level actions that they collect.

Accessibility training

Given that most websites have some sort of accessibility problems, there was some talk about how this could be improved.

One project presented showed training that has been developed to raise awareness of how people with disabilities access the web, and the implications of the accessibility guidelines. It’s a practical course including hands-on assignments, and looks like it could be the sort of thing that could help web developers make a real difference.

Social Accessibility

Another project is using crowd-sourcing to improve web sites that already exist. Social Accessibility, another IBM project, enables volunteers to make web pages more accessible to the visually impaired.

It provides a mechanism for accessibility problems to be gathered directly from visually impaired users. Volunteers are then notified, and can respond using a tool that allows them to externally modify web pages to make them more accessible. It lets them publish metadata associated with the original web page. This can be applied to the web page for all visually impaired users who visit it in future using this tool, so that many users can benefit from the improvement.

cloud4all

Finally, a project called cloud4all is developing a roaming profile that stores your preferences in a way that multiple services can access. The focus is on accessibility – a user can store their accessibility needs in one place, and then interfaces can use this to adapt for them.


Dyslexia at W4A

This is the third of four posts sharing some of the things I saw while at the International World Wide Web Conference for w4a.

There were a few sessions presenting work done to improve understanding of how to better support people with dyslexia.

One interesting study investigated the effect of font size and line spacing on the readibility of wikipedia articles.

This was assessed in a variety of ways, some of which were based on the reader’s opinions, while others were based on measurements made of the reader during reading and of their understanding of the content after. The underlying question (can we make Wikipedia easier to read for dyslexics?) was compelling. It was also interesting to see this performed not on abstract passages of text, but in the context of using an actual website.

Accessibility isn’t just about the presentation but also the content itself. Another study looked at strategies for simplifying text that could make web pages more readable for dyslexic readers.

It compared the effectiveness of two strategies: firstly, providing synonyms on demand – giving a reader a way to be able to request an alternative for any word. The second was providing synonyms automatically – with complex words automatically substituted for simpler equivalents. Again, this was assessed in several ways, such as the speed of reading, the reader’s comprehension, on the reader’s opinion of easiness, on the effort it took (e.g. interpreting facial expression, etc.), on fixation duration measured using eye tracking, and so on.

On a more practical note, there were also tools presented that are being created to help support people with dyslexia.

Firefixia is a Firefox toolbar extension being created by colleagues of mine in IBM. It provides options for users to customise the web page they are looking at, offering modifications that have been demonstrated to make it easier for dyslexic users.

Dyseggxia is an impressive looking iPad game that aims to support children with dyslexia through fun word games.


W4A : Future of screen readers

This is the second of four posts sharing some of the things I saw while at the International World Wide Web Conference for w4a.

Several of the projects that I saw showed glimpses of a possible future for screen readers.

I’ve written about screen readers before, and some of the challenges with using them.

Interactive SIGHT

One project interpreted pictures of charts or graphs and created a textual summary of the information shown in them.

I’m still amazed at this. It takes a picture of a graph, not the original raw data, and generates sensible summaries of what it shows.

For example, given this image:

It can generate:

This graphic is about United States. The graphic shows that United States at 35 thousand dollars is the third highest with respect to the dollar value of gross domestic product per capita 2001 among the countries listed. Luxembourg at 44.2 thousand dollars is the highest

or

The dollar value of gross domestic product per capita 2001 is 25 thousand dollars for Britain, which has the lowest dollar value of product per capita 2001. United States has 1.4 times more product per capita 2001 than Britain. The difference between the dollar value of gross domestic product per capita 2001 for United States and that for Britain is 10 thousand dollars.

The original version was able to process bar graphs, and was presented to W4A in 2010. What I saw was an extension that added support for line graphs.

Their focus is on the sort of graphics found in newspapers and magazines – informational, rather than scientific graphs. They want to be able to generate a high level summary, rather than a list of plot points that require the user to build a mental model in order to interpret.

For example:

The image shows a line graph. The line graph presents the number of Walmmart’s sales of leather jackets. The line graph shows a trend that changes. The changing trend consists of a rising trend from 1997 to 1999 followed by a falling trend through 2006. The first segment is the rising trend. The rising trend is steep. The rising trend has a starting value of 1890. The rising trend has an ending value of 36840. The second segment is the falling trend. The falling trend has a starting value of 36840. The falling trend has an ending value of 12606.

The image shows a line graph. The line graph presents the number of people who started smoking under the age of 18 in the US. The line graph shows a trend that changes. The changing trend consists of a rising trend from 1962 to 1966 followed by a falling trend through 1980. The first segment is the rising trend. The rising trend is steep. The second segment is the falling trend.

It’s able to interpret an image and recognise trends, recognise how noisy or smooth it is, recognise if the trend changes, and more. Impressive.

Interpreting data in tables

Another project demonstrated restructuring data tables in web pages to make them easier to explore with a screenreader.

They have an interesting approach of analysing an HTML table and reorganising it to make it more accessible, abstracting out complex sections into a series of menus.

For example, given a table such as this:

it can produce navigable menus such as this:

Even quite complex tables, with row and column spans, which would otherwise be quite difficult to interpret if read row-by-row by a screenreader, is made much more accessible.

Capti web player

Another technology I saw demonstrated was the Capti web player.

Tools such as instapaper and read it later have showed that we can take most web pages and extract the body text for the article on the page.

This capability should be ideal for visually impaired users, but the tools themselves are still quite difficult to use and integrate poorly with assistive technologies. Someone described them as obviously “designed by sighted people for sighted people”.

Capti combines this capability with an accessible media player making it easy to navigate through an article, move through a list of articles, and so on. To a sighted user like me, it looked like they’ve mashed together instapaper with an audiobook-type media player. I often listen to podcasts while I go running, and am a heavy user of pocket and Safari’s reading list. So this looks ideal for me.

Multiple simultaneous audio streams

Finally, one fascinating project looked at how to make it quicker to scan large amounts of content with a screenreader to find a specific piece of information. I’ve written before that relying on a screenreader (which creates a sequential audio representation of the information on the page, starting at the beginning and going through the contents) can be tremendously time-consuming, and that it results in visually impaired users taking considerably more time to find information on the web.

This project investigated whether this could be improved by using multiple simultaneous sound sources.

It sounds mad, but they’re starting from observations such as the cocktail party effect – that in a noisy room with several conversations going on, we’re able to pick out a specific conversation that we want to listen for. Or that a student not paying attention in a lecture will hear if a lecturer says something like “this will be on the exam”.

They’re looking at a variety of approaches, such as separating the channels directionally, so one audio stream will sound like it’s coming from the left, while another is in front. Or having different voices, such as different genders, for the different streams. It’s an intriguing idea, and I’d love to see if it could be useful.